The good news for commercial real estate
I completely understand the angst that investors have generally felt toward commercial real estate, given the recent downturn and the onslaught of continuously negative headlines trying to paint all sectors of CRE in apocalyptic terms. (Hey, fear, even if misinformed, can grab readers’ attention.) In reality, the only sector (or should I say, subsector) with truly impaired fundamentals in the equity part of the capital structure was central business center offices in states and cities suffering from outward migrations of population and wealth.
Since the dark days of the pandemic or at least mid-2021, the fundamentals of multifamily, industrial, hospitality and retail have remained strong (over 68% of the over $4.5 trillion CRE lending market), with only a few pockets of short-term weakness in slightly overbuilt hotspots in multifamily. Heck, even senior secured commercial real estate lending inflows slowed down over the past four years, despite the economically resilient and market-insensitive income stream that the strategy has continued to provide.
But again, I get it, when you are going through the second or third worst commercial real estate downturn since the Great Depression, sometimes prudence can be the better part of valor.
CRE has bottomed out
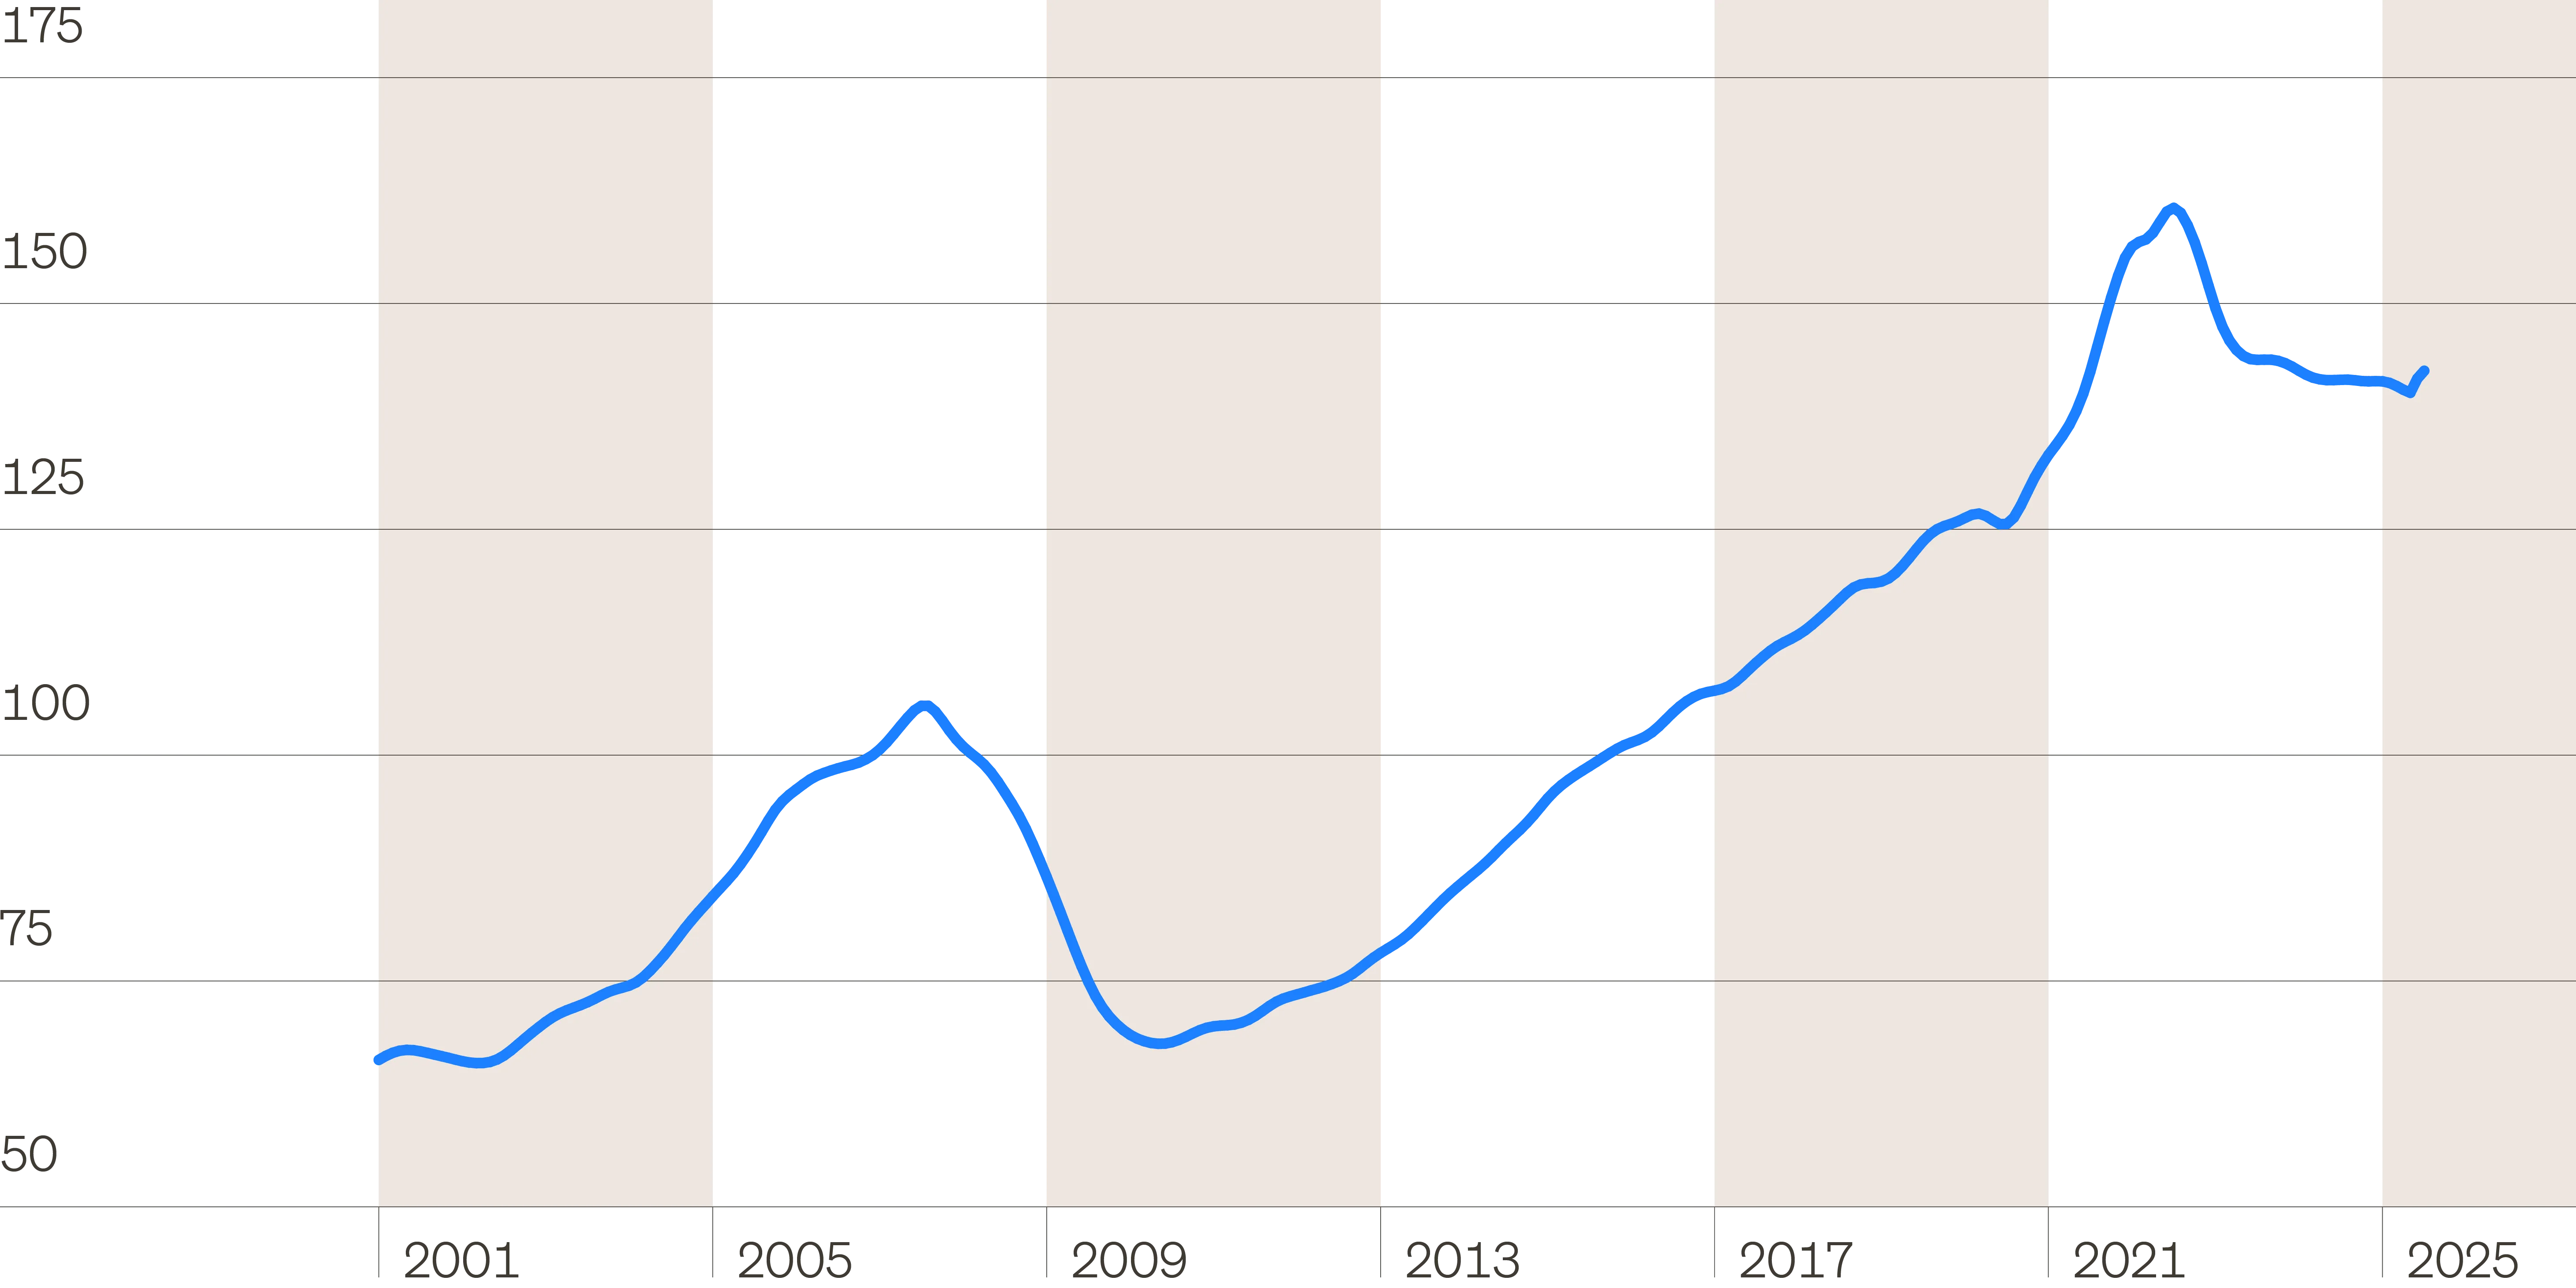
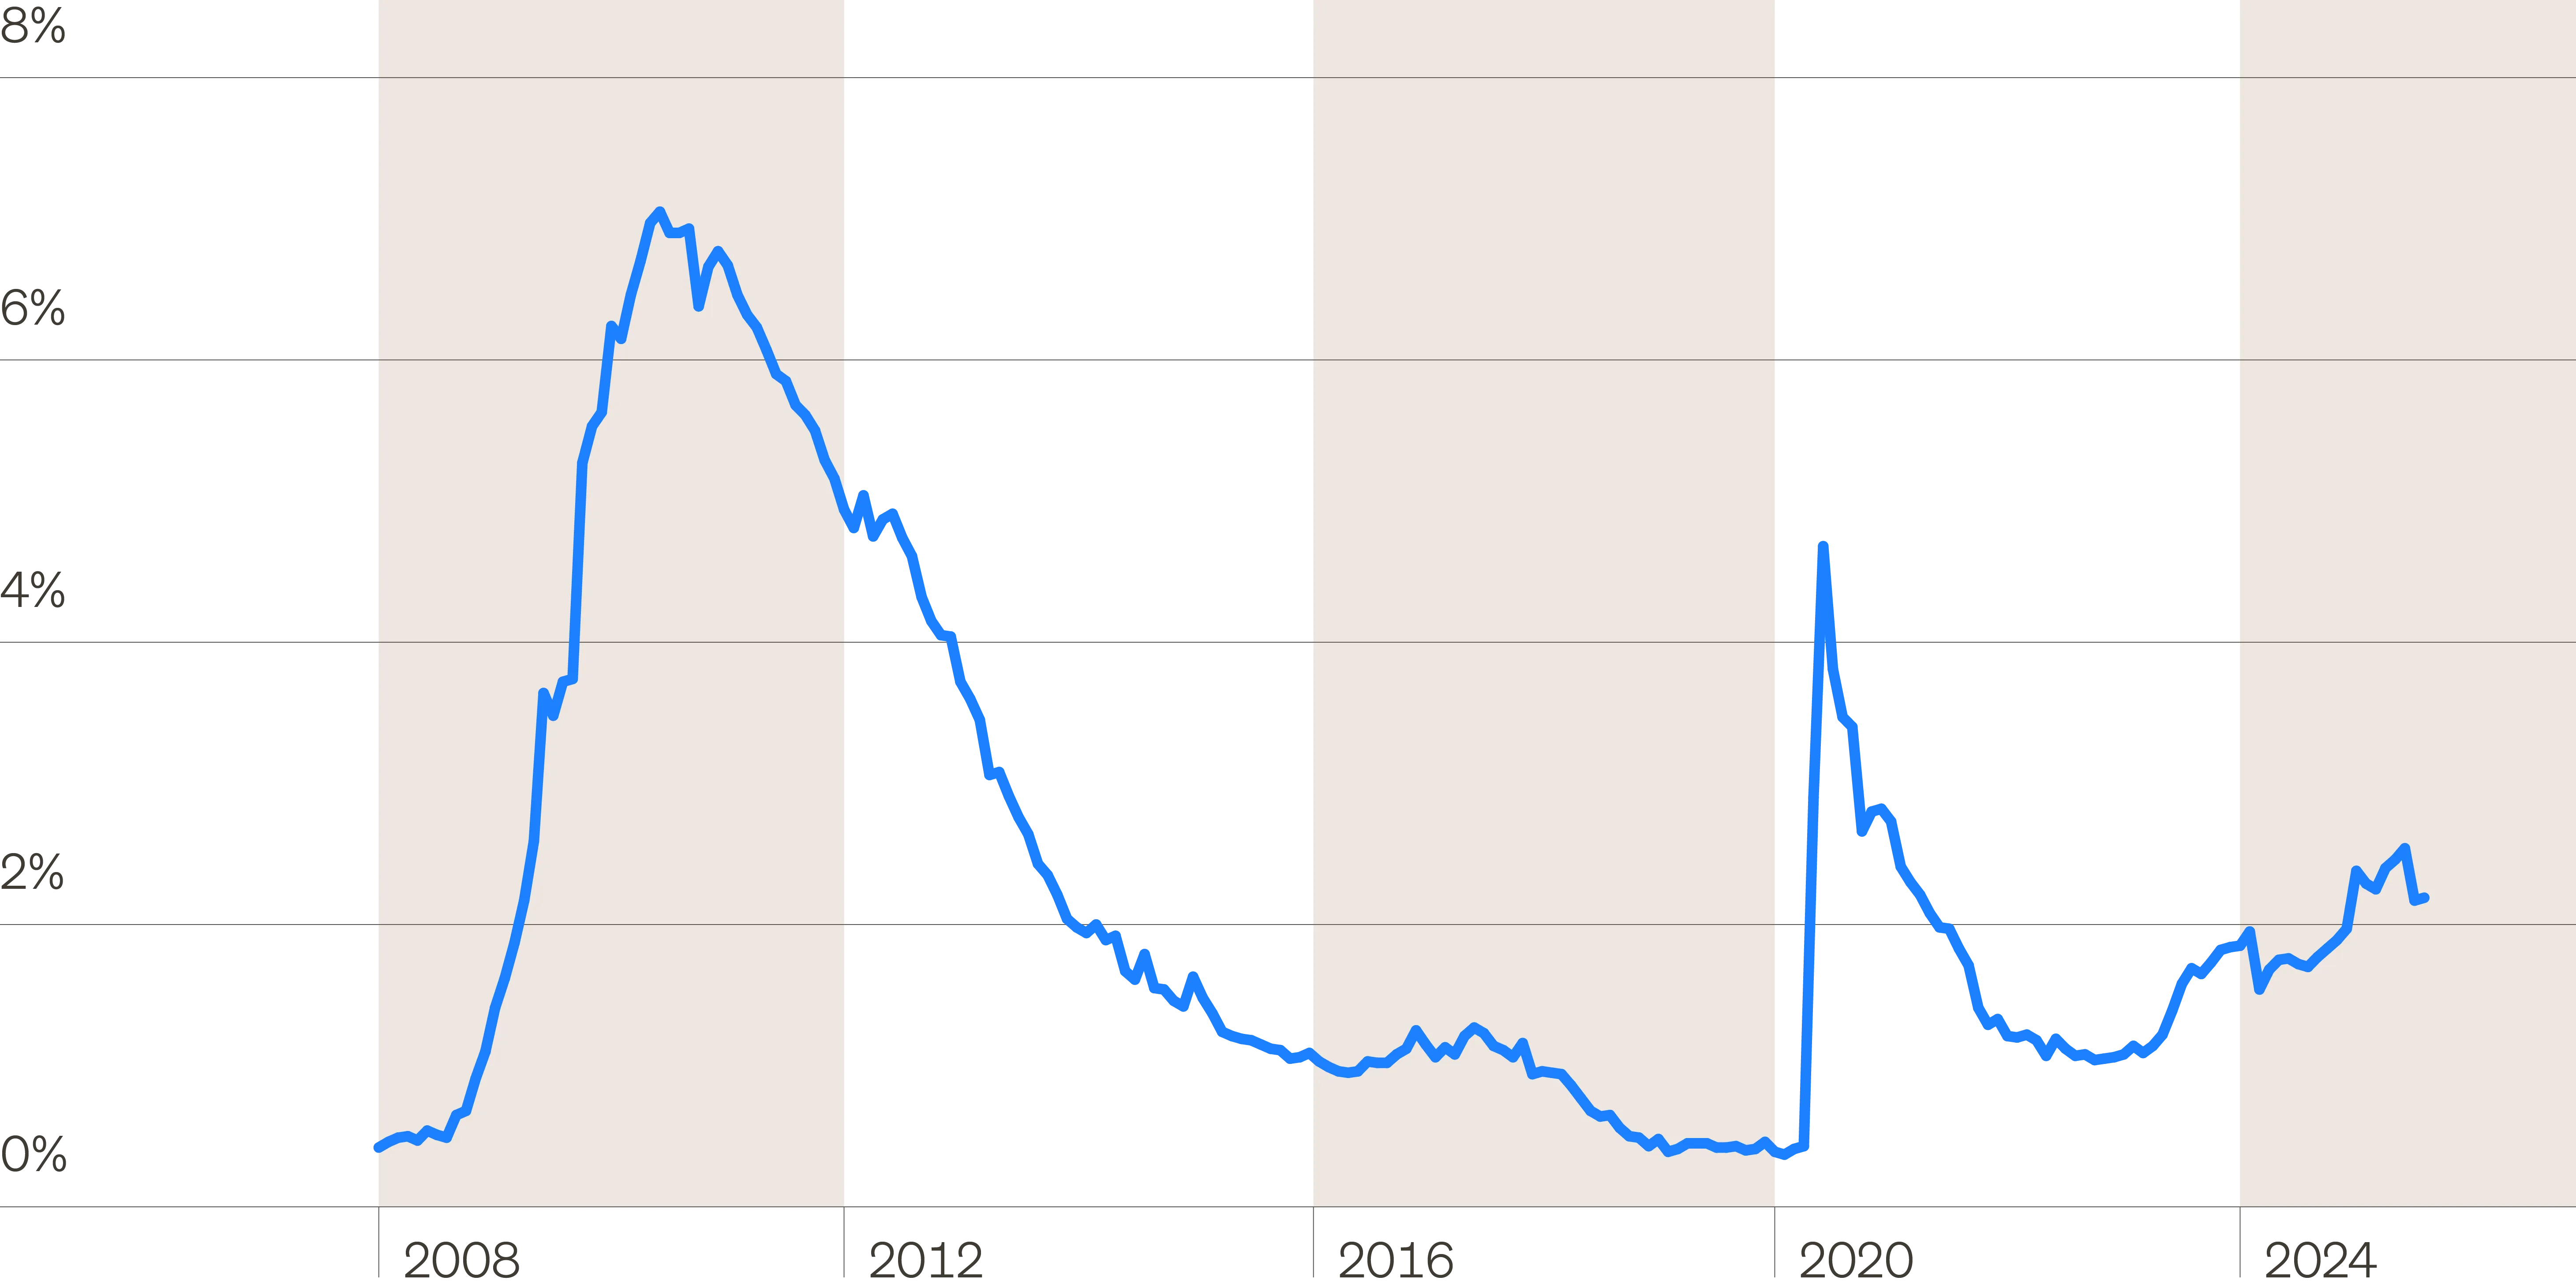
The great news now is that, unless you are a permabear of permabears on real estate (which probably means you are a permabear on most every asset class), it appears that CRE has bottomed out. As you can see from the charts below (“RCA All Property Commercial Property Price Index (CPPI)” and “Delinquencies remain low”), the recent CRE declines were quite significant, but came nowhere near approaching the Global Financial Crisis—the worst CRE downturn since the Great Depression—and the resulting pickup in defaults is still relatively modest.
RCA all property commercial property price index (CPPI)
Delinquencies remain low
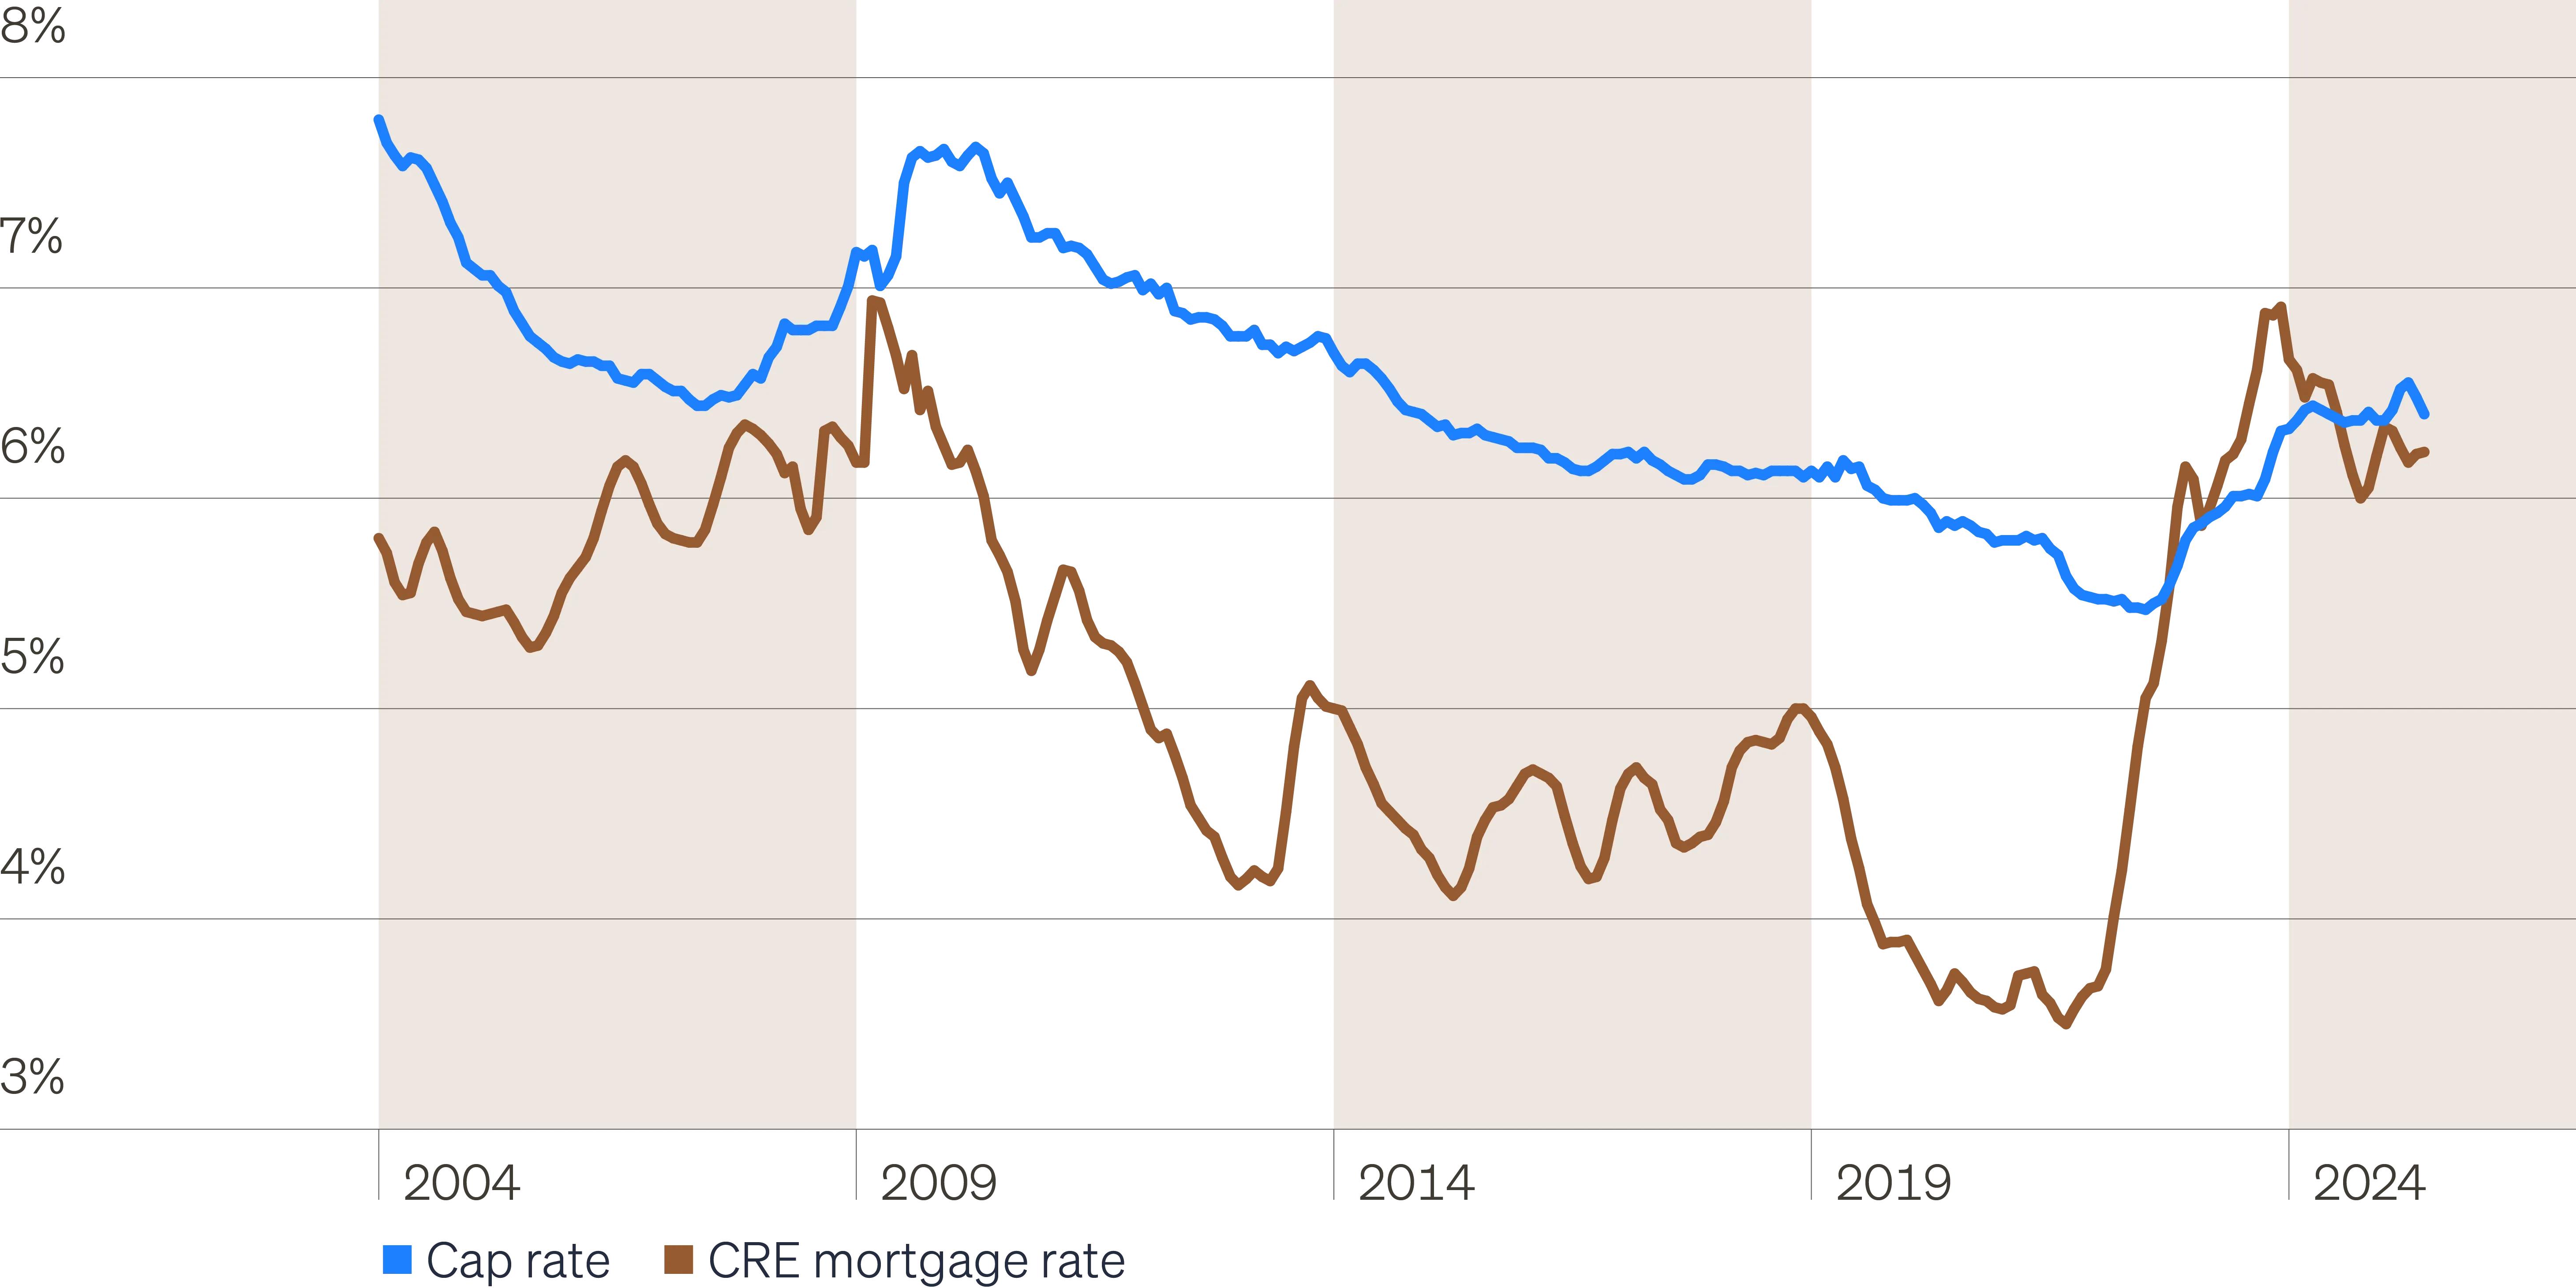
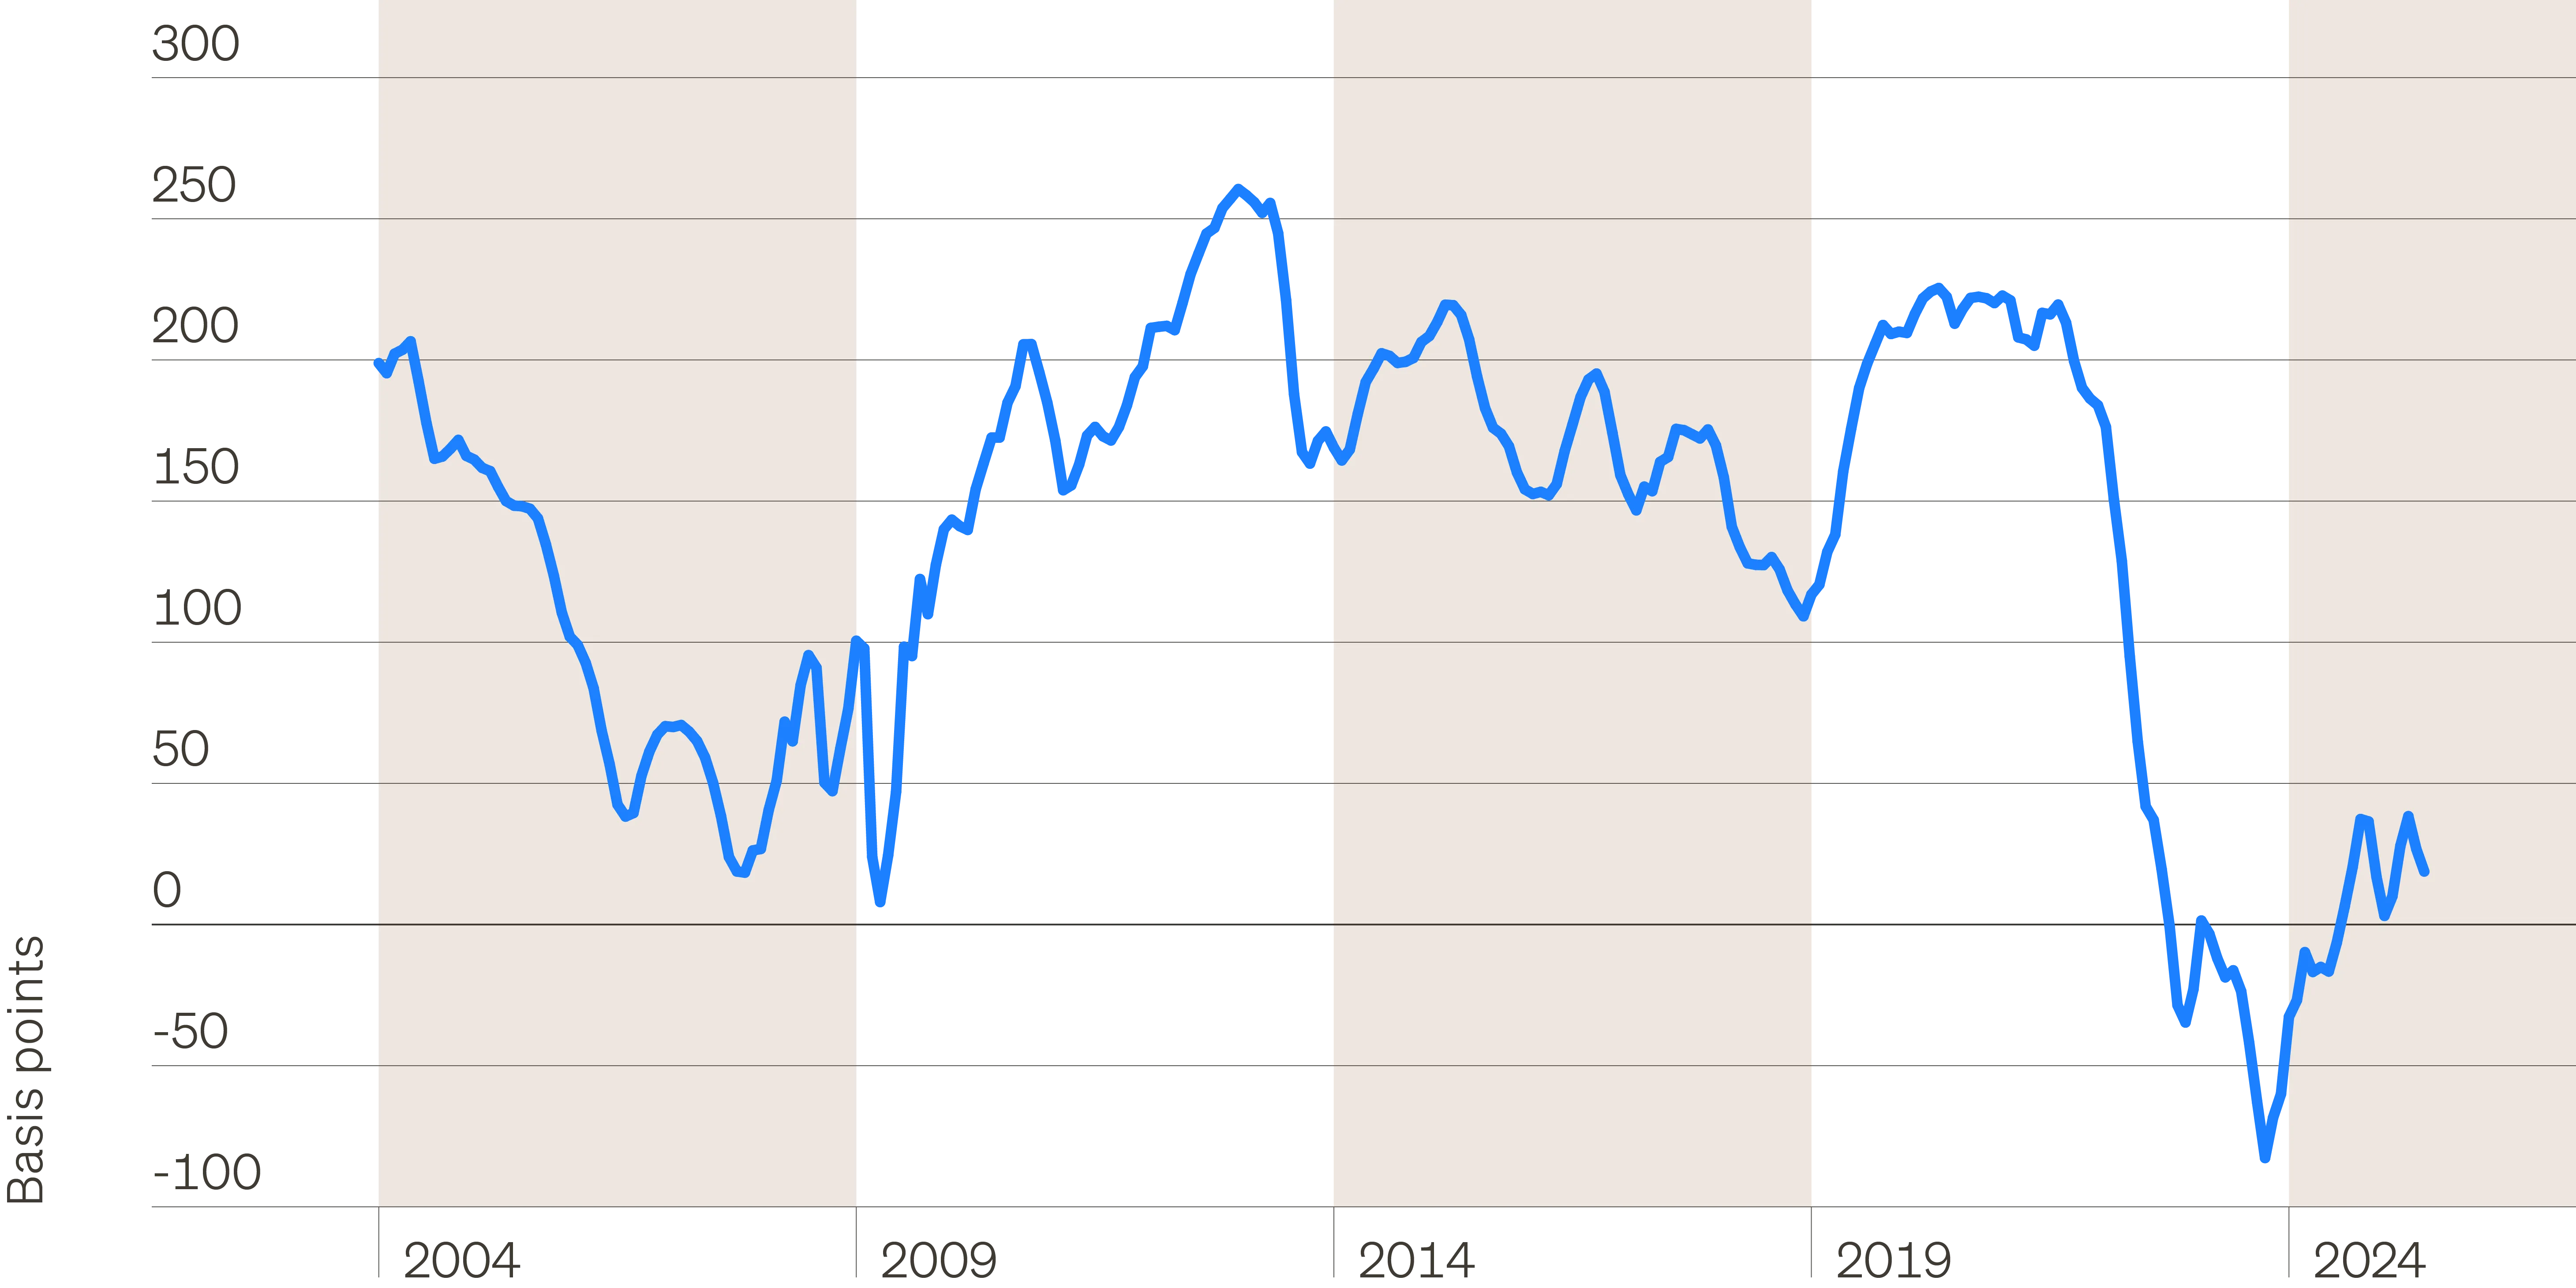
The reason one should not expect any material price appreciation—at least for the next several years—is that we still have a way to go for the cap rate to mortgage rate spread to normalize to a level that can provide an excess return to equity compared to debt. The process will continue to play out as I described two to three years ago (albeit in fits and starts), where increasing net operating income (NOI) growth goes to a higher cap rate instead of material CRE appreciation.
Rising mortgage costs may benefit lenders
Equity investors face significant headwinds
This cycle: A milder downturn
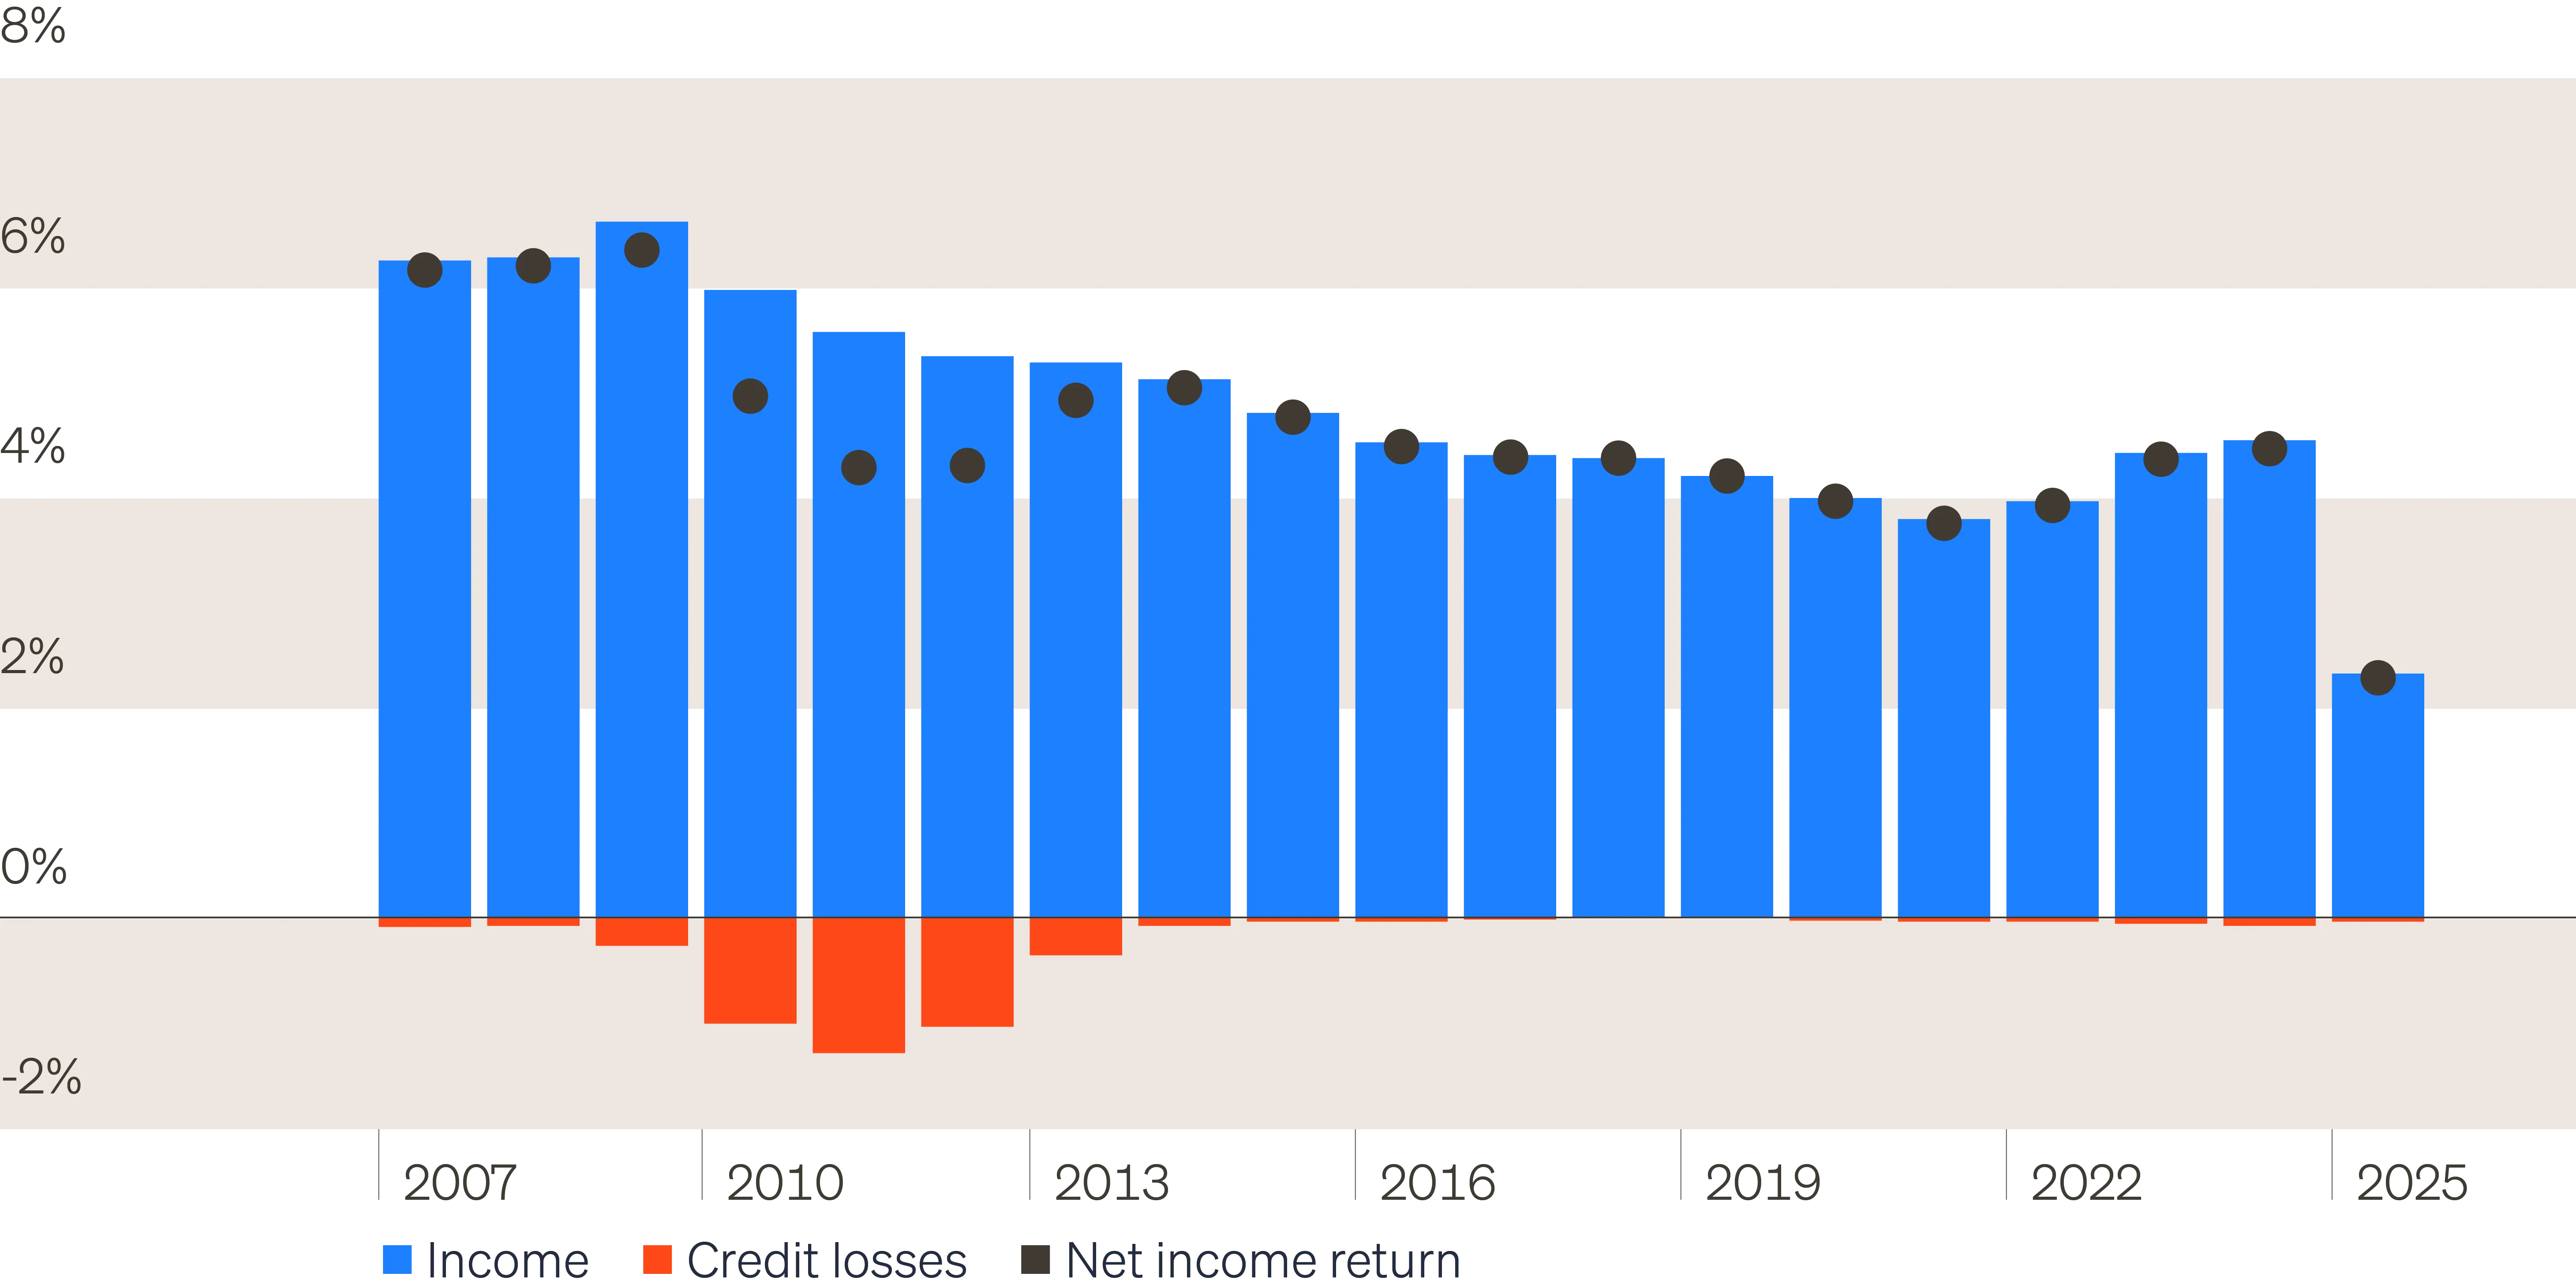
Despite the recent downturn in price, and subsequent modest increase in defaults, as you can see from the chart below (“Minimal credit losses in prior cycle”), senior CRE realized losses have been extremely mild (heck, you can barely even see them on the chart) and, fortunately, income has increased courtesy of higher interest rates.
As the chart demonstrates, this cycle has played out as one might suspect: This milder downturn than the Global Financial Crisis—with weakness concentrated in less than 16.7% of the market (total office concentration with true deterioration only in areas discussed previously)—may lead to much milder realized losses. And wouldn’t you know it, senior CRE lending is once again proving how gosh darn resilient it is to downturns, including the Global Financial Crisis, eurozone crisis, pandemic—and the one we’re coming out of.
Minimal credit losses in prior cycle
CRE lending: Why there is optimism
Now that CRE prices appear to have finally bottomed, that should at least partially explain the optimism in CRE lending on a go-forward basis. Specifically, there are trends in the local supply/demand dynamics of multifamily and industrial loans that are worthy of note.
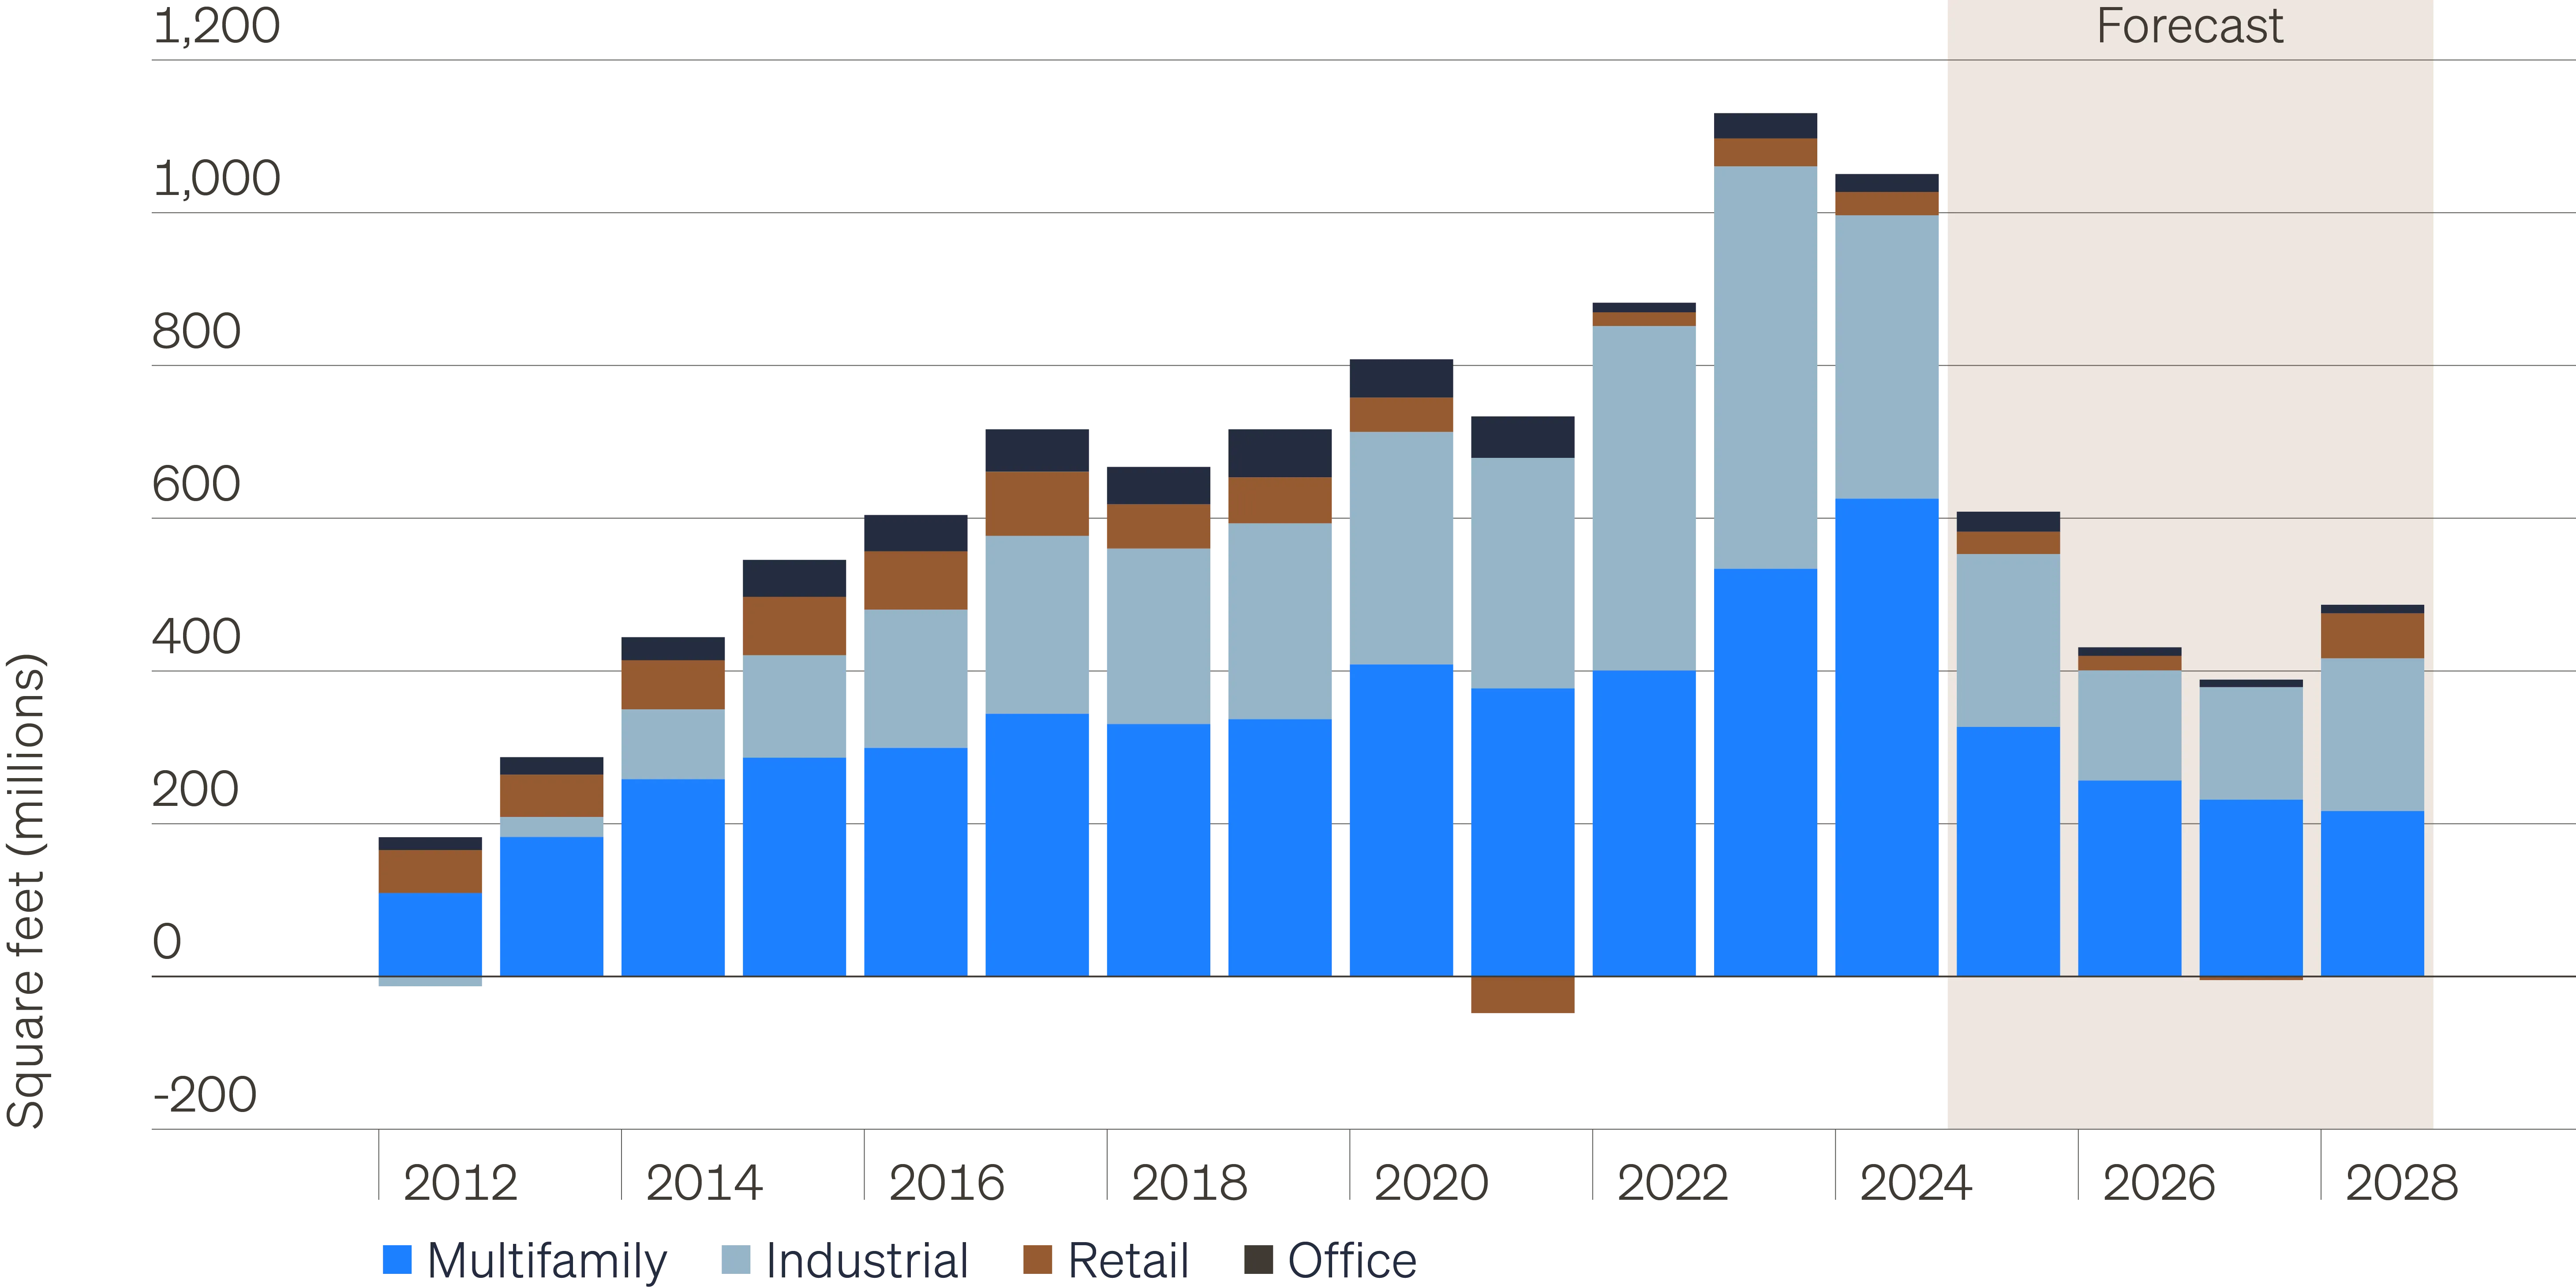
As you can see from the chart below (“Net CRE deliveries by year”), now that some of the pre-Fed-rate-hiking planned new construction is behind us, as well as the completion of new construction in hotter markets (think Austin orNashville), future new supply has collapsed down to below 2017 levels and is expected to decline even further over the next several years. Like any market, the basics of supply and demand are critically important to CRE, so nothing puts a bigger smile on a CRE lender or owner’s face than collapsing levels of new supply, particularly when the U.S. economy, consumer and corporations remain in solid health. And just to put the levels of supply below 2017 into context, the U.S. economy is now 51% bigger in nominal terms than it was at the end of 2017. Additionally, we are excited that after waiting patiently for almost four years now, there are finally high quality lending opportunities again in office. As always in commercial real estate, it’s all about location, property fundamentals, LTV, income/spread, quality of borrower, etc. We are certainly not saying that it is time to load the boat on office. However, just like we have done in the past in hospitality and retail, often time we can get the best unit of return per unit of risk in sectors that have been out of favor when the fundamentals have started to improve.
Net CRE deliveries by year
Furthermore, given the continuation of elevated mortgage rates, and an unprecedented shortage of single-family homes relative to demand (Freddie Mac’s latest estimate, as of November 2024, is we are still short 3.7 million single-family homes relative to a total stock of 1.53 million homes, or 2.4%), that should bode very well for future NOI growth in multifamily.1
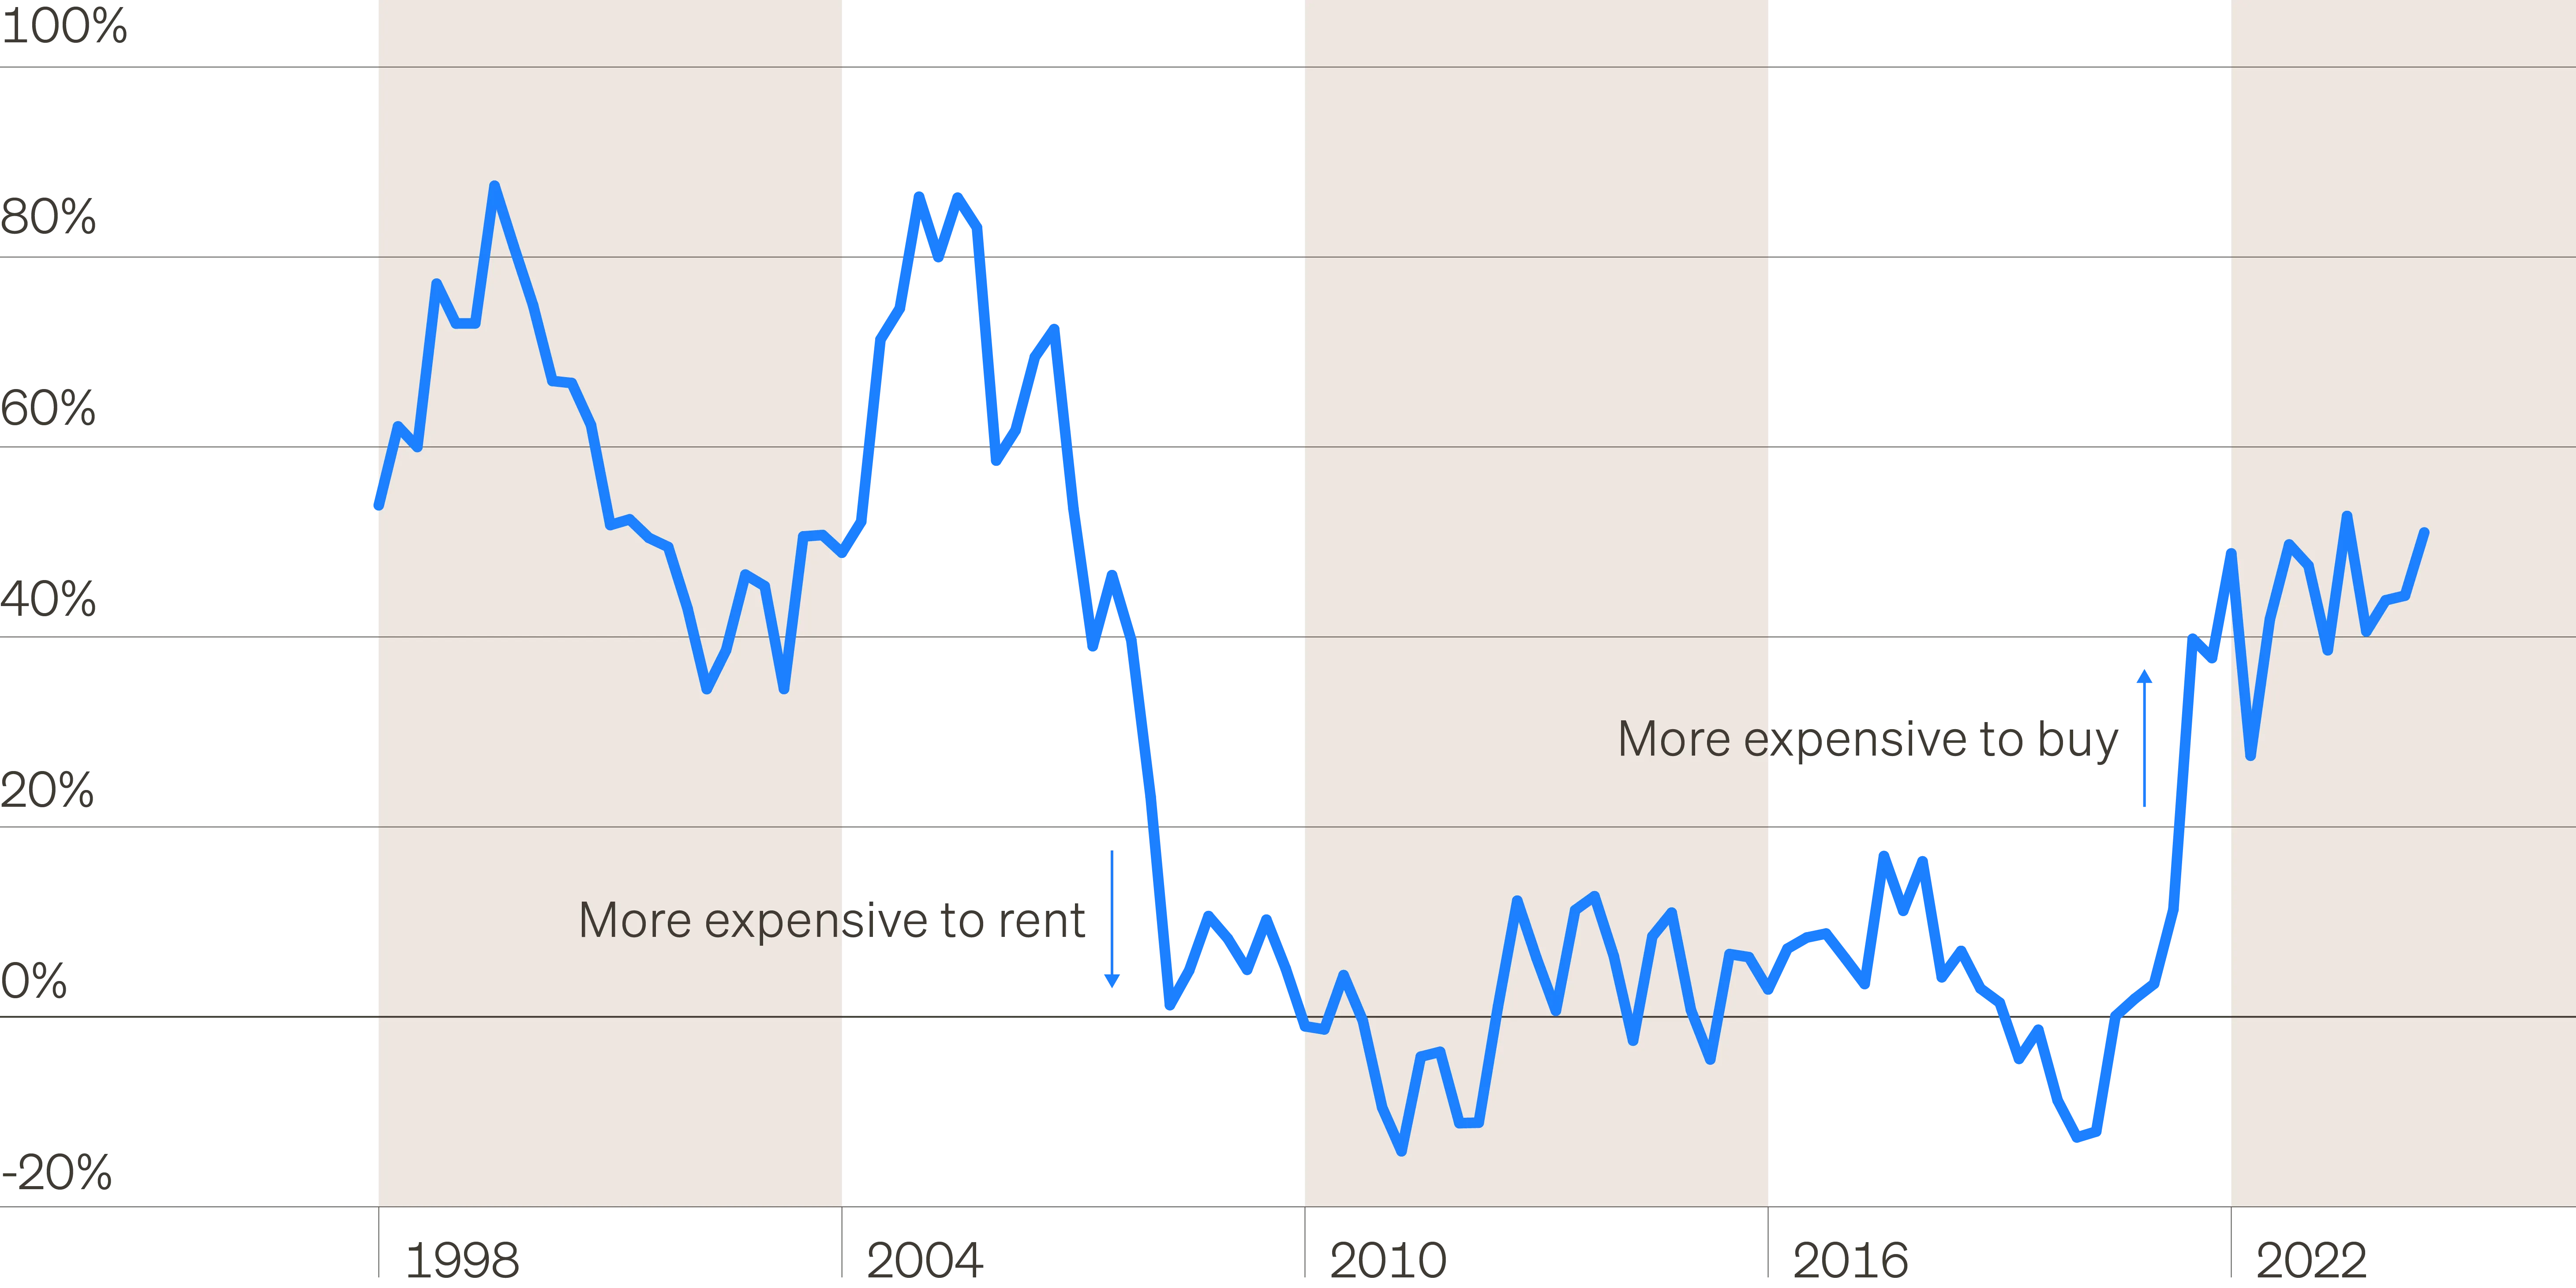
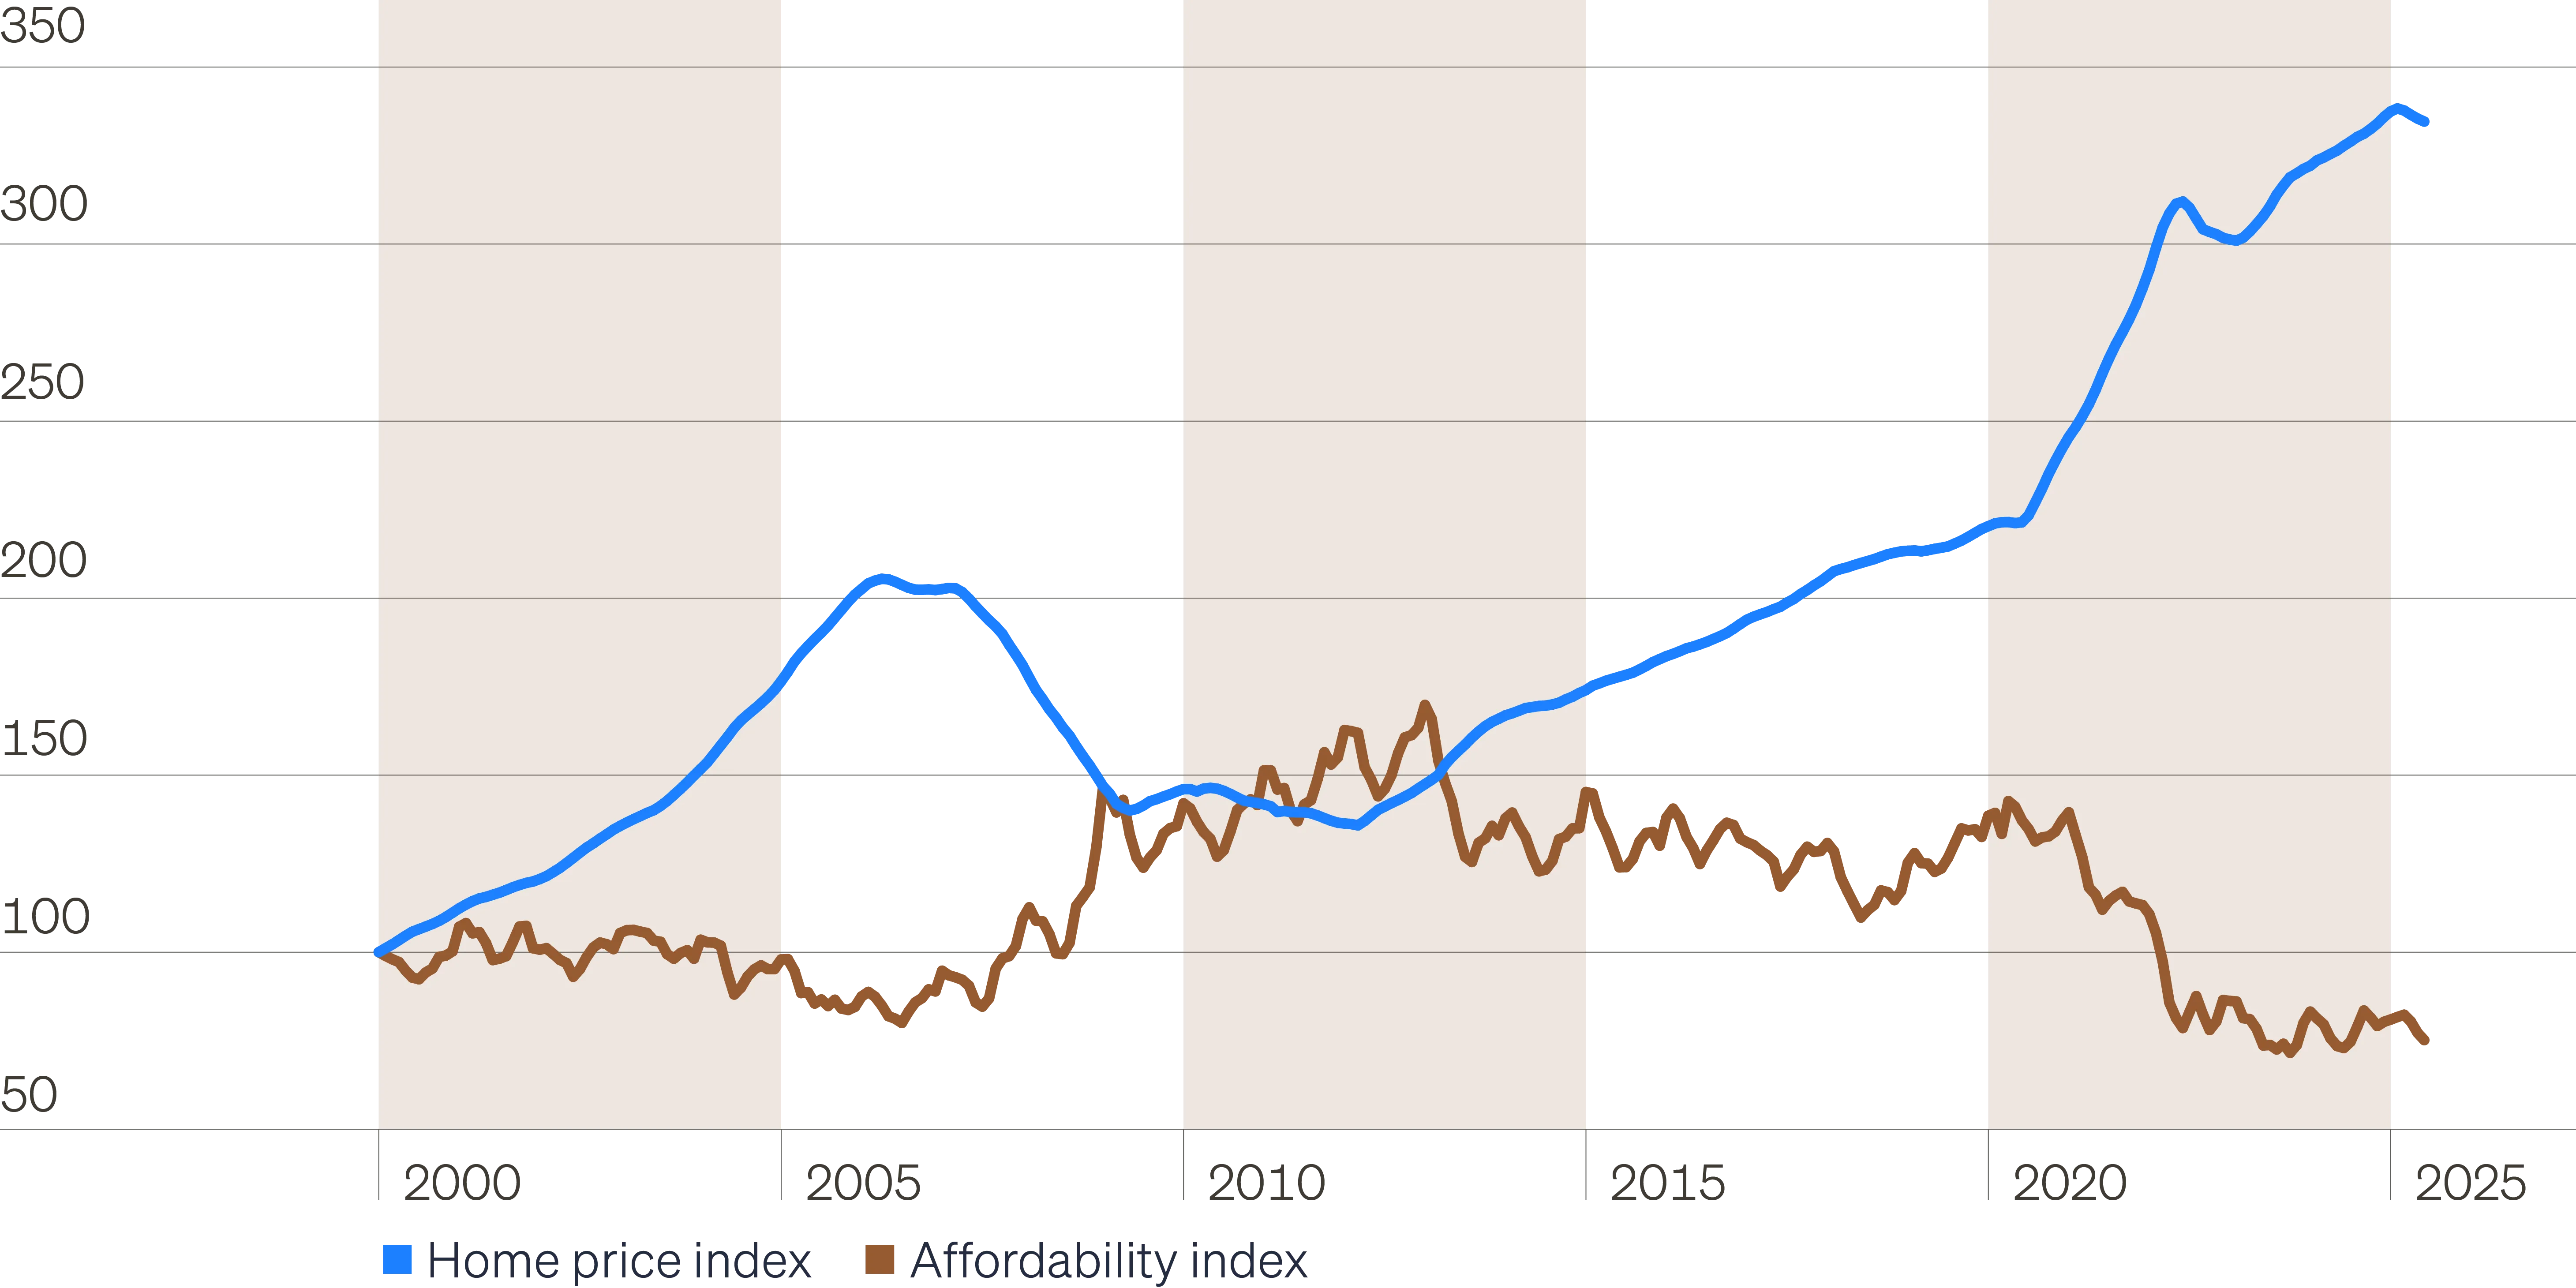
As you can see from the first two charts below (“Premium to buy vs. rent” and “Home price index vs. affordability index”), relentless home price appreciation (up until very recently) combined with high mortgage rates have driven a continued financial advantage to renting vs. owning, while simultaneously driving housing affordability back down close to recent record lows!
Premium to buy vs. rent
Home price index vs. affordability index
Higher mortgage rates
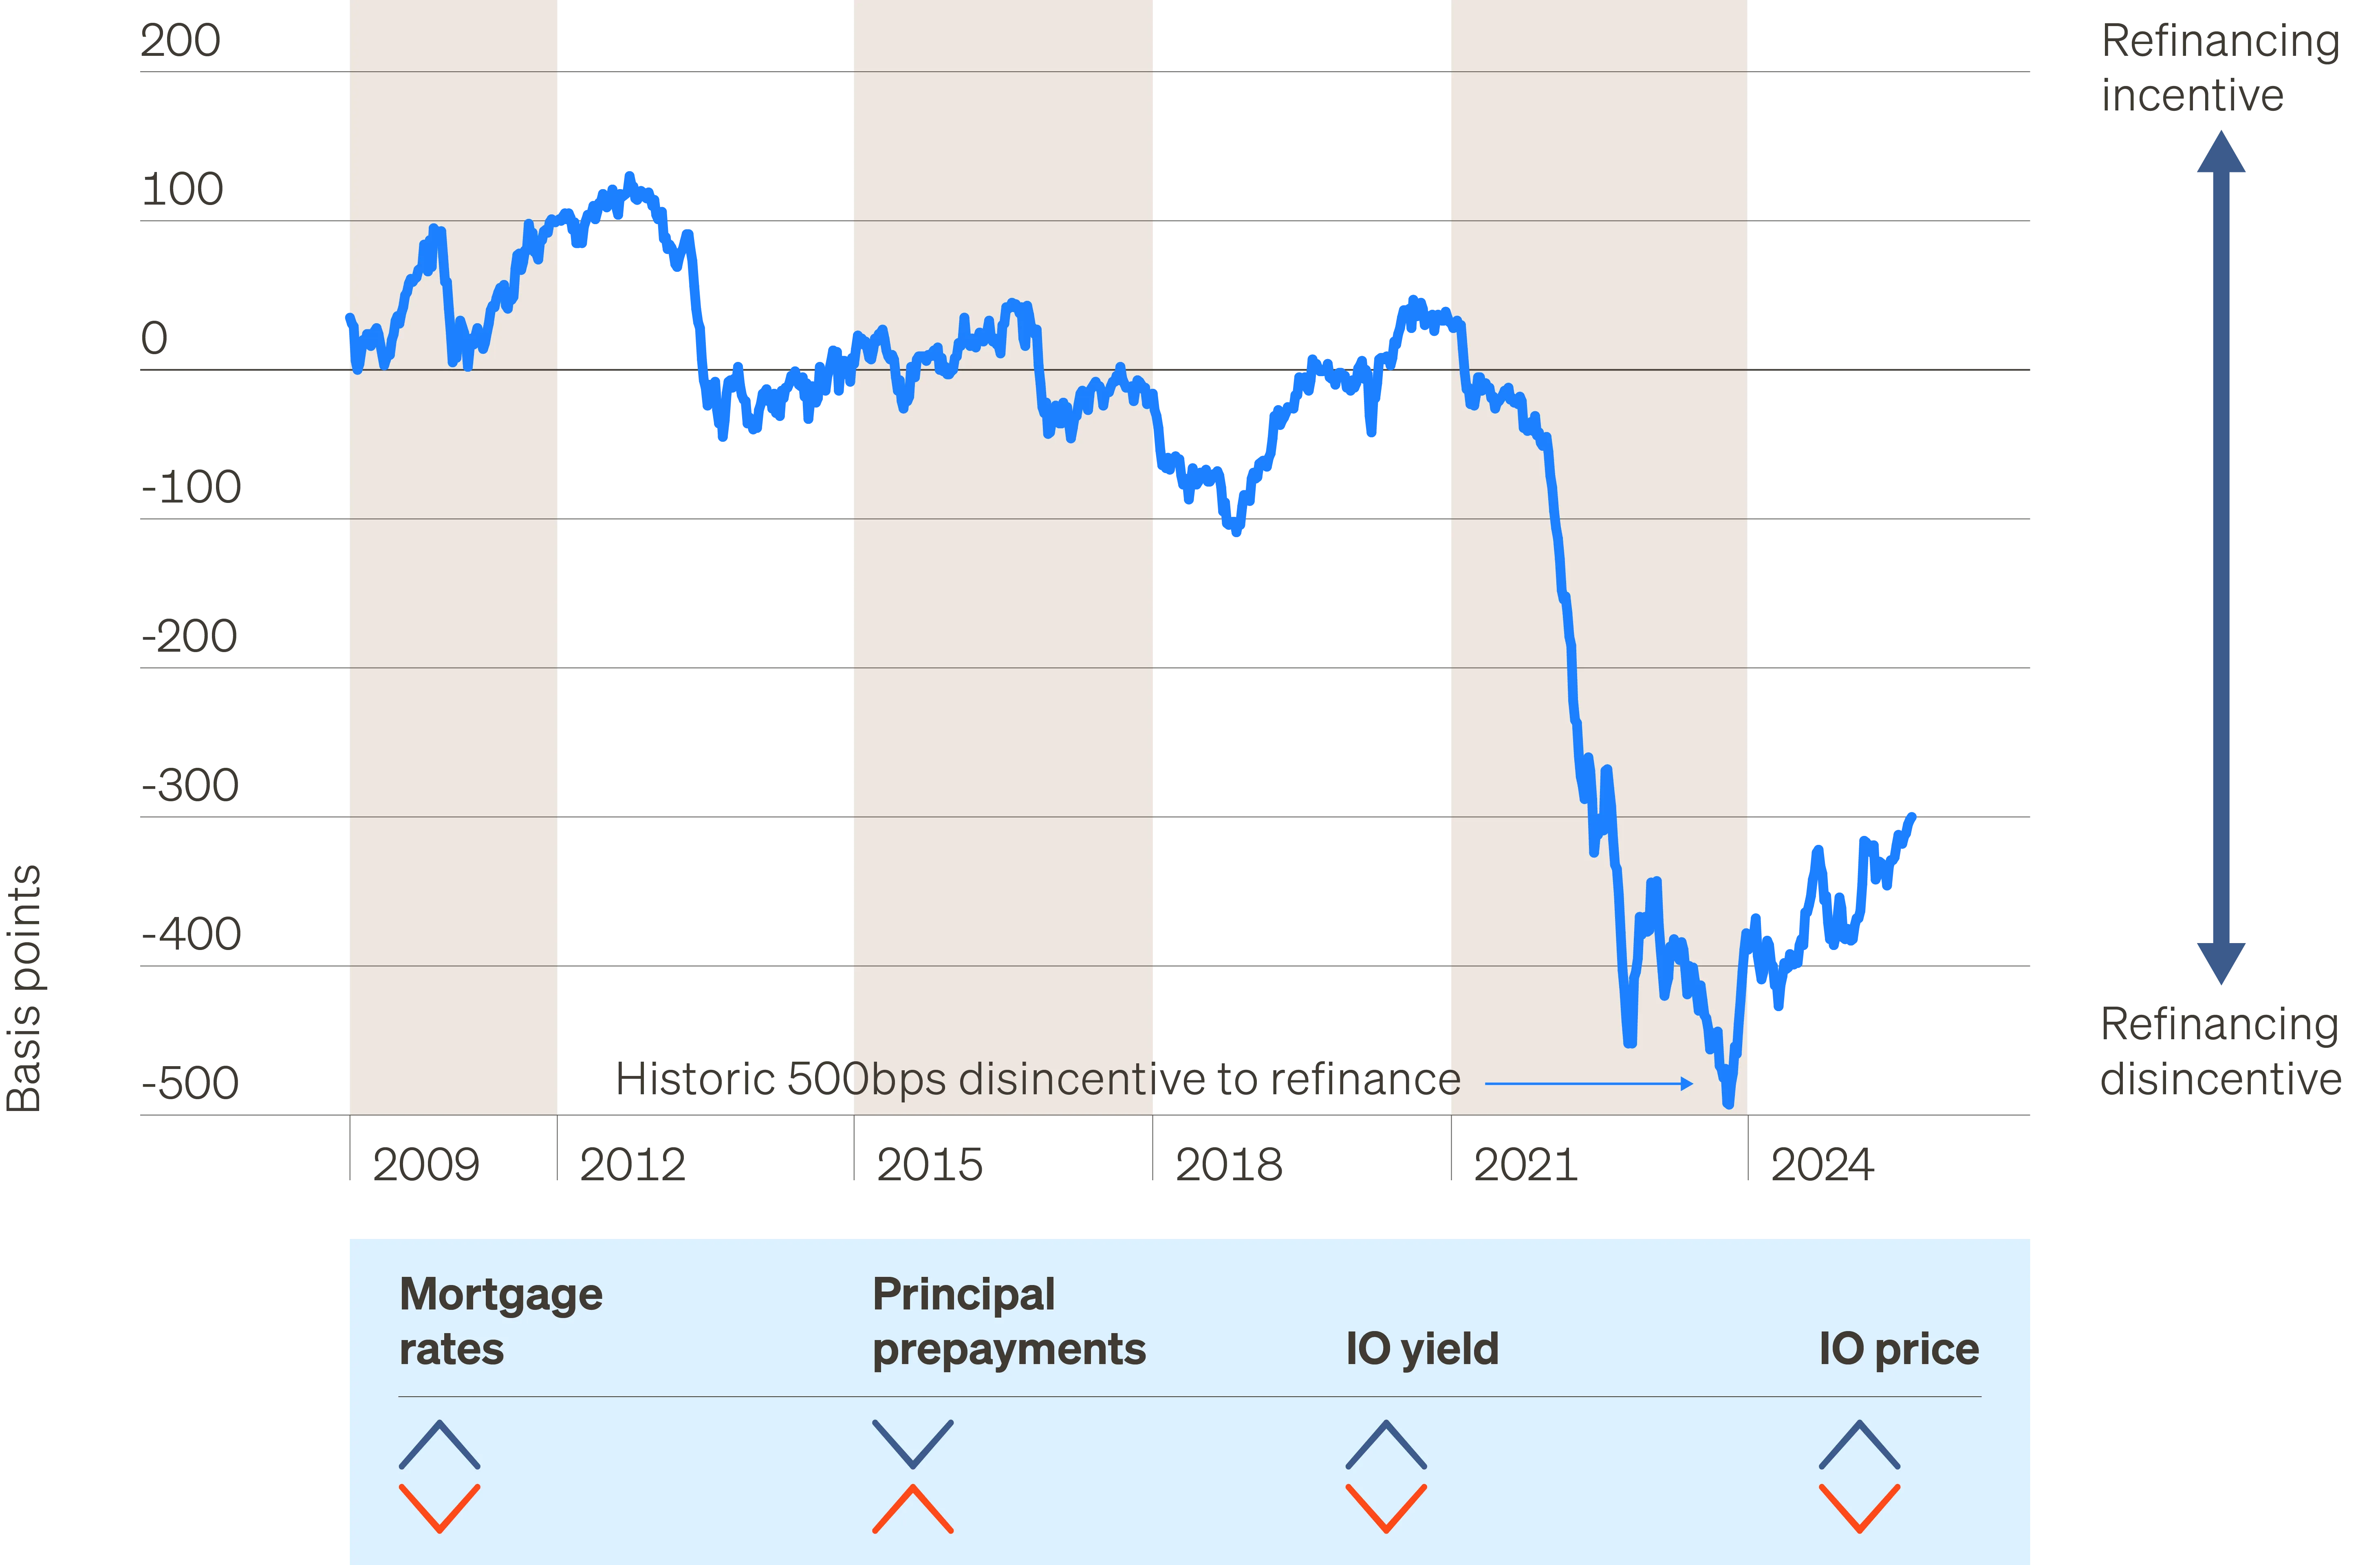
A related phenomenon is the second great secular slowdown in prepayment/refinancing activity, driven primarily by higher mortgage rates—which don’t seem to be getting materially lower anytime soon (see the chart below, “The second (current) secular slow down in prepays/refis ”).
Thus, high mortgage rates may be beneficial both to multifamily renting demand and expected continued NOI growth, plus also have the potential to provide agency residential mortgage-backed securities (RMBS), particularly agency interest-only (IOs) and inverse interest-only (IIOs), with a strong source of non-correlated income.
The second (current) secular slowdown in prepays/refis
Conclusion
Remember, when fixed income is still volatile with relatively paltry income streams particularly given the still incredibly flat yield curve, cash balances keep growing to new record highs with inevitably lower income in the future (how’s cash doing after tax and after inflation these days), and equity valuations either exceed or are close to 2021 levels, don’t sweat it: “The Time for the Right Alts is Still Now!”